


What is the charging curve of an electric vehicle?
Buckle up, it’s time to talk about the charging curve of electric vehicles (EVs). If you drive an EV, you might have noticed that it charges at a steady speed when the battery is between 20% and 80%, but then slows down outside of this range. Why? Well, it’s all about keeping your EV’s battery safe and healthy.
Just like how a 100m sprinter starts off slowly and then accelerates to reach maximum speed, an EV charging curve begins with a slower charging rate when the battery is low, and then quickly ramps up to reach the maximum charging rate around 20% battery level.
Similar to how a sprinter maintains their maximum speed for a short period of time before slowing down or they could become injured, an EV battery charges at its maximum rate for a limited time during the charging session before gradually slowing down at 80% as the battery charges up. This is to protect the battery from overheating or damage.
So, just like how a sprinter gives it their all for a brief period of time before slowing down, your EV’s charging curve is full of excitement and energy, getting you charged up and ready to go in no time!
Other factors such as battery temperature, battery condition, limitations on local power supply and the weather can cause the charging rate to vary, resulting in a different curve even if you arrive to the same charger with a similar SOC (state of charge).
Simply put, the charging curve shows you the maximum charge your vehicle can get throughout the charging process. Knowing this for your EV can help you plan your charge time, so you can hit the road quickly instead of twiddling your thumbs waiting for that final 10% of charge.
Did you know: When charging at a PoGo Charge site and making use of the PoGo Touch charger you can view a real-time visual update of the active charging curve – on the screen and via a screen QR code.
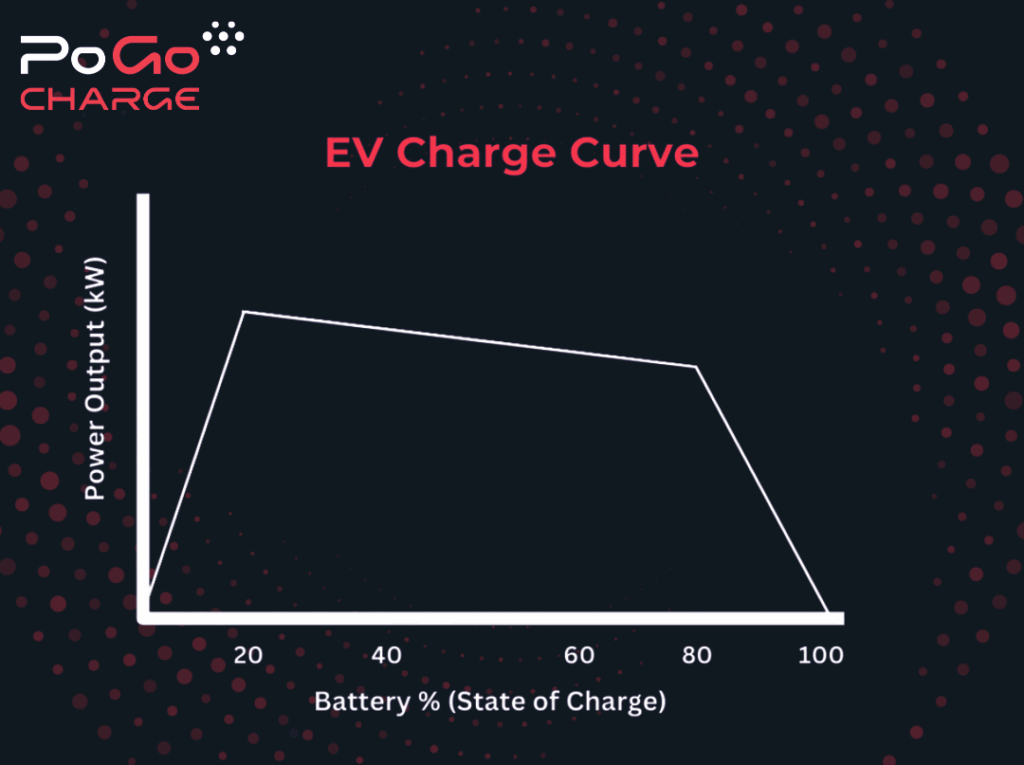
The graph below gives a visual representation of the above explanation- the battery sprints to its maximum charge rate and then gradually slows down over time as it recharges (graph for illustrative purposes only).